Copyright © 2005-2024 TradeTools FX All rights reserved.
Software for Forex, Binary Options and сryptocurrency brokers.
+1 708 515 4598 info@tradetoolsfx.com

Charts in MetaTrader 4/5 display changes in currency and stock quotes over time. They are essential for technical analysis and trading robots. Charts allow you to visually follow the quotes of financial instruments in real time and instantly react to any changes in the markets.
Charts have a lot of different settings, and you can customize them to your needs. MetaTrader 5 supports three types of charts: broken line, bars and Japanese candlesticks. You can change the color of each item. Flexible settings allow you to create a comfortable workspace for long-term work.
In addition, you can create different templates and profiles for charts in MetaTrader 5. In the templates, you can save color schemes and analytical objects overlaid on the chart, and in the profiles - all the templates of all open charts. They can then be used to quickly restore the working area of the platform.
There are 21 timeframes available for each chart in MetaTrader 5 - from one-minute to monthly. Quotes for currencies and stocks can be presented in the timeframe that best suits any particular trading system. In addition, additional information is displayed on charts (tick volumes, last price line, OHLC line and so on), which facilitates technical analysis for traders.
The wide variety of options for working with charts in MetaTrader 5 is used in technical analysis. Over 80 most popular analytical tools are integrated into the platform: technical indicators and graphical objects.
All analytical objects can be applied directly to the chart or open in a separate sub-window. You can open an unlimited number of instruments in one chart and analyze the dynamics of quotes or shares from different perspectives.
In addition, it is possible to construct technical indicators based on the data of other indicators. For example, the Bulls Power technical indicators can be applied to the chart together with the Bears Power and their data can be smoothed by means of the moving average.
In short, charts in MetaTrader 5 offer all possibilities for full-fledged technical analysis. Set up charts the way you like and analyze quotes using technical indicators and graphical objects - your platform is very convenient!
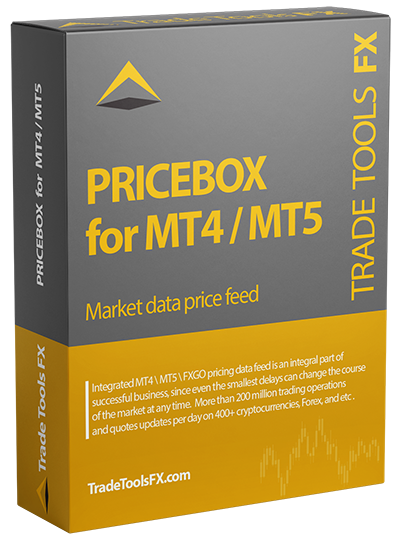
TradeToolsfx metatrader markets data price feeder has more than 3,000 tools, you will have something to work with!
For more details and discount, contact : https://t.me/tradetoolsfxtech
Report
My comments